OVER FIVE YEARS OF RIOT!
This is the Riot for Abundance for Jan-May 2104. I know. I didn’t keep details for each month, so this is a mix of cold and warm months but averages will have to do. We had two extra adults for a while, but mostly it was for the three of us (two adults, one eight-year-old). Edson fixed the calculator: all go tither to crunch those numbers! And here’s another fun website for the mathematically inclined: Do the Math.
Gasoline. Â Calculated per person.
15 gallons pp. per month
36.5% of the US National Average
Electricity. This is reckoned per household, not per person. We cook on an electric stove, had seedlings under lights and on a heat mat for three months, and chicks under a heat lamp for two – accordingly, we usually use the most electricity from March to May.
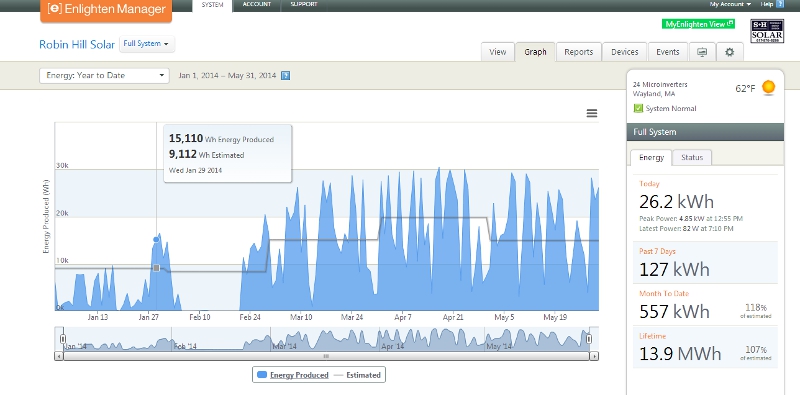
According to our solar meter, we produced 13749 kWh since the system was turned on in August 2011 and 1831 kWh over the last five months (you can follow our solar harvest live here).  The month of February was particularly horrible: even if the panels hadn’t been encased in snow, this dark dark month wouldn’t have done much better. Check out this graph, of our year-to-date production:

.As a result of this , we had to buy 857 kWh from Nstar. Our consumption of this amount plus what we produced oourselves (and subsequently consumed), comes to:
537.6 kWh per month
29.7%Â of the US National Average
Heating Oil and Warm Water. This too is calculated for the entire household. It was co-old in the early months of the year. Since the solar hot water panels (installed in February last year) were just as ice-locked as the PV, the furnace also took care of most of the hot water.
 30.81 gallons of oil / month
51% of the US National Average
Water. This is calculated per person. We continue doing well in this category, and I don’t know how.
524 gallons pp. per month
17.5%Â of the US National Average
Trash. After recycling and composting this usually comes down to mainly food wrappers.
6 lbs. pp per month
4.4 %Â of the US National AverageÂ
