Is this neat or what? We have a SECUSOL system, manufactured by Wagner. The MassCEC sprang for the monitoring system. They get valuable data (which they use to determine rebates, etc.) and we get to look in.
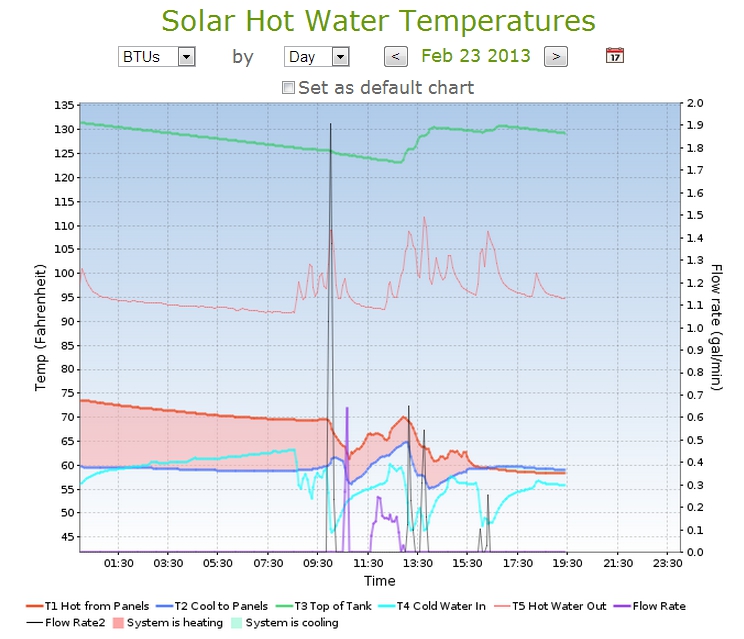
The chart above is today’s. It was grey throughout. The top of the water tank (green line at the top), where the heated water hangs out, waiting to be drawn on, hovered around the desired 130F. However, as you can see by the thick red line bordering the pink area, the temperature of the heat exchange fluid coming from the panels was only around 70F to begin with, dipping further as the day got colder and the clouds thicker. That means that our backup (oil furnace) had to kick in the difference.  That also means, however, that it was doing some of the heating (indicated by the pink area) of the water in the cold bottom part of the tank. At 5:30, for instance, the heat exchange fluid released about 10F to that water: it was going into the tank from the panels at 70F and coming out again, as indicated by the thick blue line, at a little below 60F. Around 15:30 (3:30 pm for you Americans) the fluid in the panels was no longer warmer than the cold water in the bottom of the tank, so the system shut down, not wanting to cool the water in the tank.
(The thin black lines are interesting too: this flow rate indicates our water consumption. That tall peak around 9:30 is me taking a shower, and the two peaks around 13:30 are us replenishing our fish tank, and the last two peaks are DH clearing the drains).
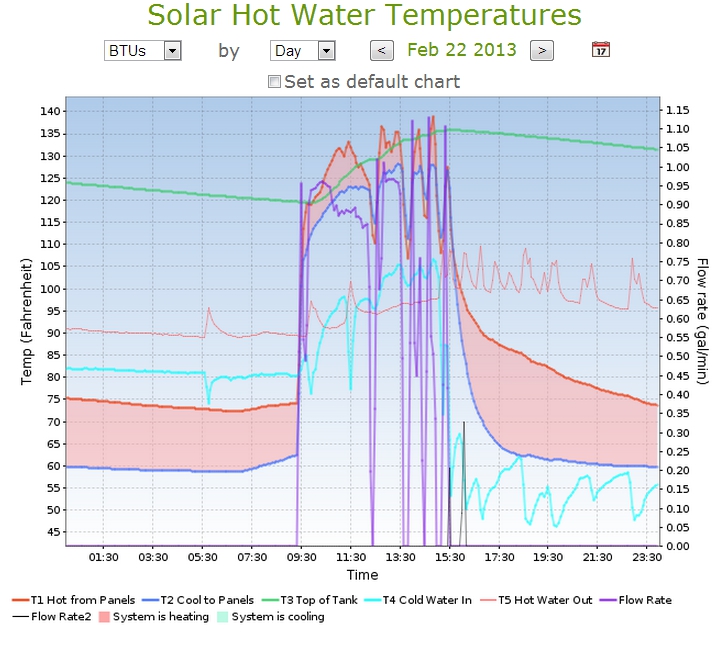
Below is yesterday, the 22nd of Feb, a very sunny day and a very different chart from today’s. The panels provided enough and, between 9:30 and 15:30, sometimes even more than enough, heat to get the water in the tank to the desired temperature.

Now I’m thinking we should adjust our water consumption schedule: shower on sunny days, and later in the day too. But first we’ll gather more data.
Leave a comment