OVER FIVE YEARS OF RIOT!

Well. It’s been a while, but the meters keep rolling, the numbers keep coming in, and comparisons keep being made. This is the Riot for Abundance for the months of November and December 2104 and January, February and March 2015, for the three of us (two adults, one nine-year-old). Edson fixed the calculator: all go tither to crunch those numbers! And here’s another fun website for the mathematically inclined: Do the Math.
Gasoline. Â Calculated per person. This is usually our weakest point in the Riot, but it became a little less weak in January, when we exchanged one old Volvo V70 for a new, much more efficient WV Jetta. (We plan to exchange the other one sometime this year.) We didn’t drive much, didn’t do many long trip, so we did well:
10.92 gallons pp. per month
26.6% of the US National Average
Electricity. This is reckoned per household, not per person. We cook on an electric stove and because we keep the house on the cold side, we occasionally turn on the electrical heater in the bathroom. A week ago we also turned on the grow lights and the heat mat in the basement. That’s the debit side. On the credit side, we are FINALLY making our own electricity again, after the snowbank that sat on our panels for months, slid off in one huge avalanche that bent our copper gutters.
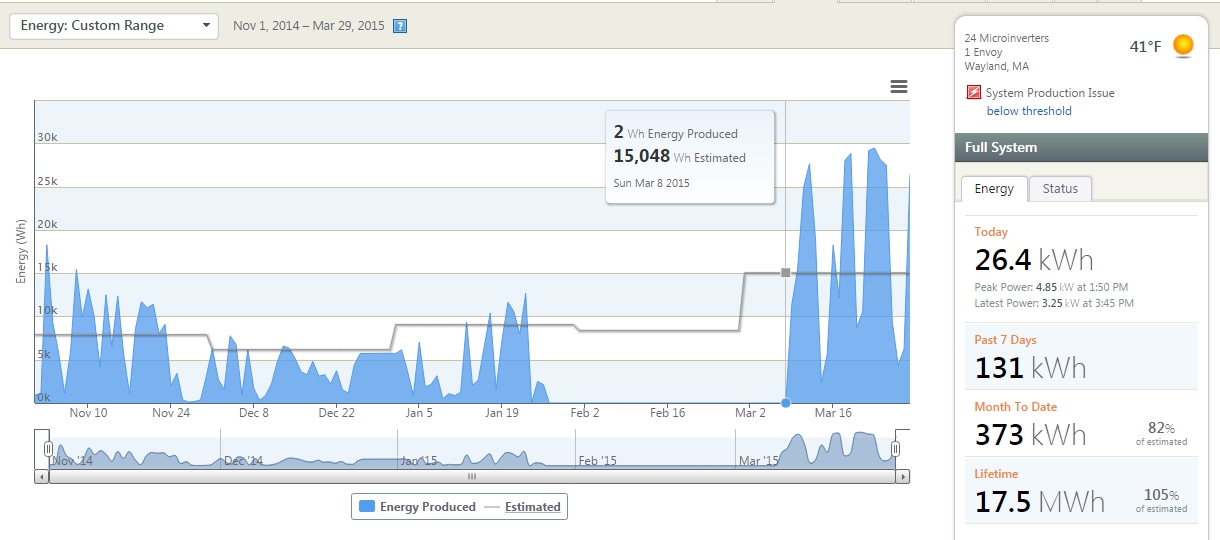
Lastly, in January we made the switch, via Mothers Our Front, to the Mass. Energy Consumers Alliance (“Mass Energy” for short) New England GreenStart, which ensures all our electricity comes from a mix of local green sources (it costs 2.4 cents per kWh we use in addition to our regular monthly electricity charges). This keeps us even more on our toes when switching on lights in the house. So, the numbers then. According to our solar meter, we produced 17246 kWh since the system was turned on in August 2011 and 823 kWh between Nov 1 and March 29 (the period in the image above- you can follow our solar harvest live here). We obviously underproduced over these last five months, so had to buy 1642 kWh from Nstar (328.4 kWh per month). So we consumed 1642 + 823 kWh and that comes to
493 kWh per month
27.3% of the US National Average
Heating Oil and Warm Water. This too is calculated for the entire household. It has been a harsh winter, as any New Englander will tell you. Our solar hot water system (installed in February last year) did not take care of a lot of water heating, as it too, along with the PV panels, was encased in ice and snow for months. All this shows in our oil consumption
 51 gallons of oil / month
82.7% of the US National Average
Water.
17.7% of the US national average
Trash. After recycling and composting this usually comes down to mainly food wrappers.
6 lbs. pp per month
4.4 %Â of the US National AverageÂ